Anyway lets move further and Analyse what could be road ahead for Nifty & Nifty Bank for next week.
Nifty View
Now lets have look at spot Nifty Daily Chart. (Old chart of last post)

Now lets have look at updated Spot Nifty Daily Chart

We can see that Bulls managed to take support at 10285 mark (our previous support level) but now going forward close below that may trigger more downside levels.
Further as discussed in our daily posts if Bears manage to close below 10285 may trigger Bearish Pattern known as Inverted Flag & Pole for which downside for levels are 10190-10084-9743 (final target)
Now lets have look at spot Nifty Weekly Chart. (Old chart of last post)
Now lets have look at spot Nifty Daily Chart. (Old chart of last post)

(Incase if you are not able to view full image click on image to enlarge)

We can see that Bulls managed to take support at 10285 mark (our previous support level) but now going forward close below that may trigger more downside levels.
Further as discussed in our daily posts if Bears manage to close below 10285 may trigger Bearish Pattern known as Inverted Flag & Pole for which downside for levels are 10190-10084-9743 (final target)
Now lets have look at spot Nifty Weekly Chart. (Old chart of last post)

Now lets have look at updated Spot Nifty Weekly Chart

Weekly 20 & 50 EMA comes at 10423 & 9923 respectively
Nifty Bank View
Now lets have look at spot Nifty Bank Daily Chart. (Old chart of last post)

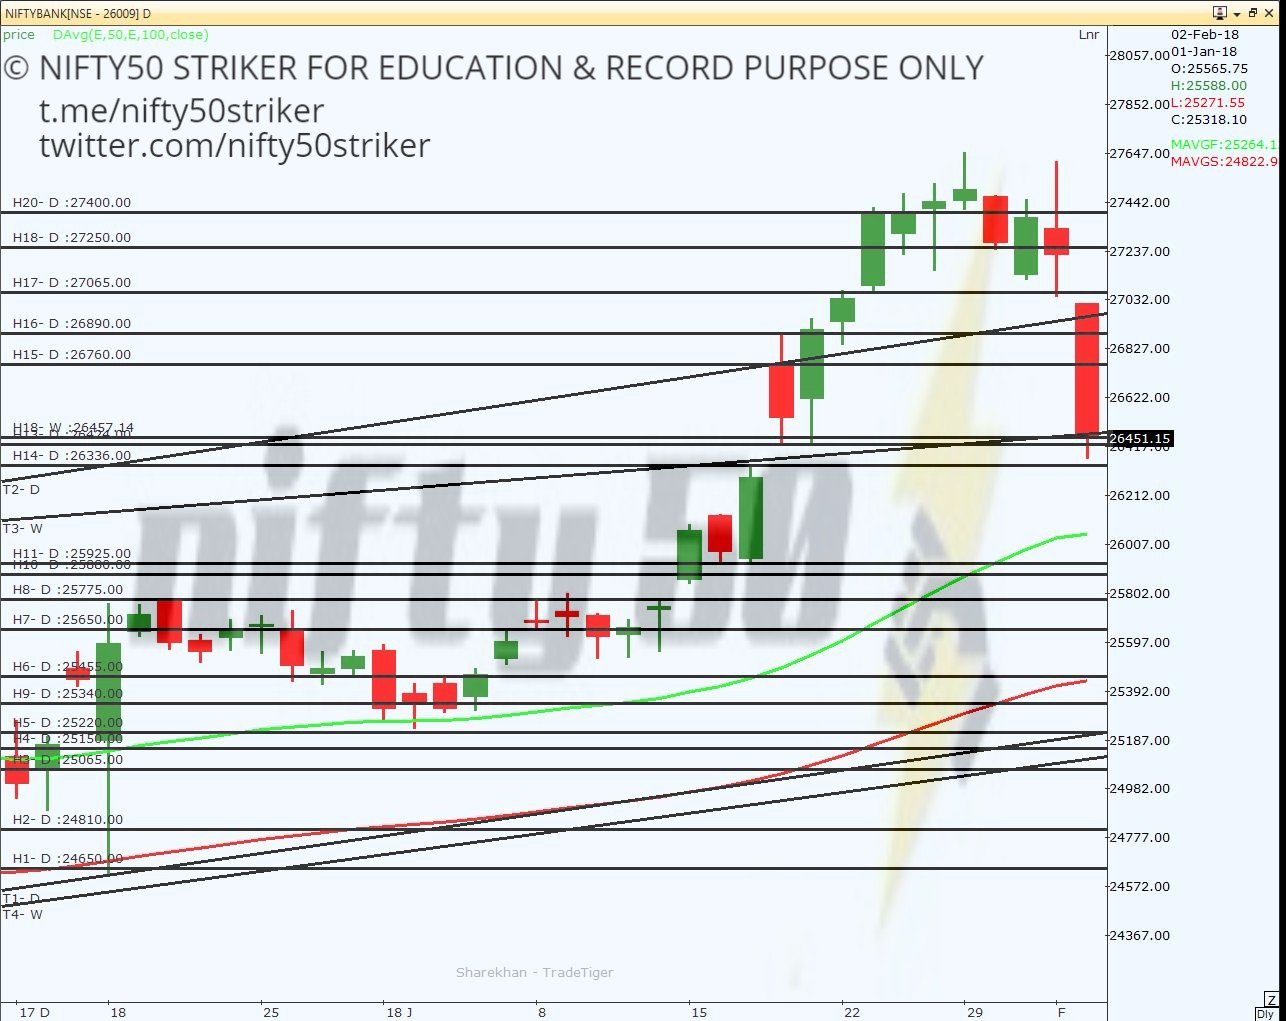
Now lets have look at spot updated Nifty Bank Daily Chart

We can see that Bulls managed to take support at lower trendline of channel pattern. Further like Nifty, Nifty Bank is also forming Aggressive Bearish Pattern which may get activated with close below recent of 25023 and that may trigger more downside levels of 24812-24502-23498 as per pattern (Inverted Flag & Pole)
Now lets have look at spot Nifty Bank Daily Chart. (Old chart of last post)

(Incase if you are not able to view full image click on image to enlarge)
Now lets have look at spot updated Nifty Bank Daily Chart

(Incase if you are not able to view full image click on image to enlarge)
Now lets have look at spot Nifty Bank Daily Chart. (Old chart of last post)

(Incase if you are not able to view full image click on image to enlarge)
Now lets have look at spot updated Nifty Bank Daily Chart

On weekly charts we can say Wedge got negated and going forward recent low near to 25000 may act as crucial level till February series expiry.
------------------------------------------------------------------------------
FROM 12th FEBRUARY 2018 WE ARE GOING TO CONDUCT ONLINE TECHNICAL ANALYSIS WORKSHOP DAILY FOR ONE HOUR FOR JUST 5000/- (SPECIAL FOCUS ON OPTION CHAIN AND OPTION TRADING) AND AFTER TRAINING 3 MONTHS FULL SUPPORT SHALL BE GIVEN SO AS TO UNDER ACTUAL IMPLEMENTATION OF STRATEGIES DISCUSSED DURING WORKSHOP. TO KNOW MORE CALL OR DROP WHATSAPP MESSAGE/TELEGRAM 08866145155 OR WRITE AN EMAIL NIFTY50STRIKER@GMAIL.COM
------------------------------------------------------------------------------
RECORDING OF FREE WEBINARS CAN BE FOUND ON
------------------------------------------------------------------------------
FOR LIVE MARKET UPDATE JOIN:-
WE ALSO CONDUCT ADVANCE TECHNICAL ANALYSIS COURSE ONLINE AND/OR OFFLINE MODE. FOR MORE DETAILS CONTACT NIFTY50STRIKER@GMAIL.COM AND/OR 08866145155
------------------------------------------------------------------------------
------------------------------------------------------------------------------
IN CASE OF ANY QUERY/SUGGESTIONS READERS ARE REQUESTED TO CONTACT US NIFTY50STRIKER@GMAIL.COM OR 08866145155
------------------------------------------------------------------------------
Please note this blog post is for education purpose only. While utmost care is taken while writing this post but any human error cant be ruled out and we apologize for same in advance.
No comments:
Post a Comment
Note: only a member of this blog may post a comment.